 With the rapid advancement of computers and digital communications in recent years, it has become a common thing to find old or standard equipment reinvented with new and modern functions. This has also been the case for metrology with many measurement instruments now featuring wireless connectivity and the ability to instantly store and share their measurement data on a computer.
These features enable the users to view the readings in a completely new way and use them in further calculations with ease. The Vernier Graphical Analysis tool is an application designed for academic use to help students collect and analyse data in a convenient manner.
This application helps the students’s understanding of scientific experiments and also enables them to share their results easily. The Vernier Graphic Analysis tool can collect data wirelessly form a number of supported sensors and can even generate data from built in sensors like accelerometers inside a users phone.
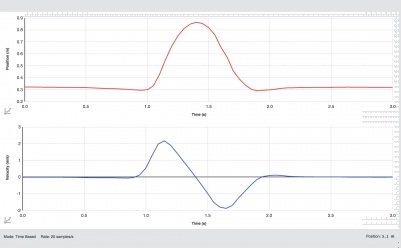
This data can then be used to generate graphs to show the trends in the experiments, analyse the data further, compare it with other results and also use it in further calculations. The tool is very user friendly and the graphs can be interacted with using an intuitive multi touch interface which supports actions like pinching, tapping and dragging.
The application has been developed by Vernier who have 35 years of experience in the experimental equipment and related software. The application can be downloaded on multiple platforms like android and windows so that data sharing can take place easily whether you are at home, at school or on the go.